- GDP
- Inflation
- International Trade
- Supply and Demand
- Market Structures
Positive: Claims that attempt to describe the world as is. Very descriptive.
Ex. minimum wage laws causes unemployment.
Normative: Claims that attempt to prescribe how the world should be. Very prescriptive in nature and opinion based.
Ex. the government should raise the minimum wage.
Needs vs. Wants
Needs: Basic requirement for survival
Wants: Desire of citizens and broader than your needs
Scarcity vs. Shortage
Scarcity: Most fundamental economic problem facing all societies. Satisfying unlimited wants with limited resources .
Shortage: Quantity demanded is greater than quantity supply.
Goods vs. Services
Goods: Tangible Commodities
- Consumer Goods: goods that are intended for final use by the consumer
Services: Work that is performed for someone else.
Factors of Production
- land
- labor
- capital
Physical: human made object used to create other goods and services
Entrepreneurship: innovative and risk taker
Trade Offs - Alternatives that we give up whenever we choose on course of action over another
Opportunity Cost- Most desirable give up by making a decision
Production Possibility Graph
- Shows alternative ways to use resources
- Each point shows a trade off


*on the curve = attainable
Point D (inside curve)
- decrease in population
- recession
- war
- famine
- underemployment
- unemployment
- economic growth
- technology
- new resources
Productive Efficiency
- any point on the curve
- concave out
- producing at the lowest cost allocating resources efficiently and full employment of resources
- where to produce on the curve
- looking for the best combination possible
- Two goods are produces
- Full employment
- Fixed resources (land, labor, capital)
- Fixed state of technology
- No international trade
Demand: the quantities that people are able and willing to buy at various prices
The Law of Demand: there is an inverse relationship between price and quantity demanded. When price increases, quantity decreases. When price decreases, quantity increases. (Demand Curve goes down)
What causes a "change in quantity demanded"? (∆ QD)
∆ in Price
What causes a "change in demand"? (∆ D)
- ∆ in buyer's taste (advertising)
- ∆ in number of buyers (population)
- ∆ in income
- Normal Goods: goods that buyers buy more of when their income rises
- Inferior Goods: goods that buyers buy less of when their income rises
- ∆ in price of related goods
- Substitute Goods: goods that serve roughly the same purpose to buyers. ex. coke & pepsi
- Complimentary Goods: goods that are often consumed together. ex. care & gas, fries & ketchup
- ∆ in expectations (thinking of the future)
Elasticity of Demand: tells how drastically buyers will cut back or increase their demand for a good when the price rises or falls
- Elastic Demand: demand will change greatly given a small change in price (wants)
- E > 1
- Ex. movie tickets, steak, fur coats
- Inelastic Demand: demand for a product will not change regardless of price (needs)
- E < 1
- Ex. milk, gasoline, medicine
- Unit Elastic: E = 1
- (New Quantity - Old Quantity) ÷ Old Quantity
- (New Price - Old Price) ÷ Old Price
- abs(% ∆ in Quantity) ÷ abs(% ∆ in Price)
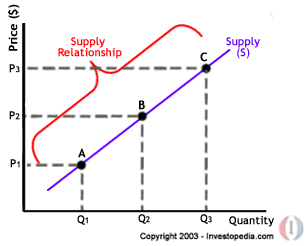
Supply: the quantities that producers or sellers are willing and able to produce or sell at various prices
The Law of Supply: There is a direct relationship between price and quantity supplied. As price increases, quantity increases. As price decreases, quantity decreases. (Supply curve goes up)

What causes a "change in quantity supplied"? (∆ QS)
∆ in Price
What causes a "change in supply"? (∆ S)


Price Ceiling- Government imposed limit on how high you can be charged for a product or service
- Below the equilibrium point
- Ex. Rent Control
- Above the equilibrium point
- Ex. Minimum Wage
Fixed Cost (TFC)- a cost that does not change no matter how much is produced
Variable Cost- a cost that fluctuates
Total Cost = TFC + TVC
Marginal Cost = New TC - Old TC
Average Fixed Cost = TFC ÷ Quantity
Average Variable Cost = TVC ÷ Quantity
Average Total Cost = AFC + AVC or TC ÷ Quantity
Shortage: QD > QS
Surplus: QS > QD
I found a website that may help you practice with supply & demand problem (mainly the calculations).
ReplyDeletehttp://economics.about.com/od/coststructure/ss/revenue_costs.htm
This khan academy video helps explain macroeconomics and microeconomics.
ReplyDeletehttps://www.khanacademy.org/economics-finance-domain/macroeconomics/gdp-topic/econ-intro-in-macro-tutorial/v/introduction-to-economics
Hope it helps.