Sunday, May 17, 2015

Absolute vs. Comparative Advantage

Absolute
  • Individual - Exists when a person can produce more of a certain good/service than someone else in the same amount of time
  • National - same as individual
  • Looking at what's faster, more efficient
Comparative
  • Individual/National - When they can produce good/service at a lower opportunity cost than another individual or nation
  • Only one nation can have the absolute advantage in one product
  • Looking at lower opportunity cost
Input Problem vs. Output Problem (Comparative)

  • Input Problem - What can be produced using least amount of resources (land or time)
    • Chosen Item/Forgone Item


  • Output Problem - Deals with production
    • What is given up/what is produced
  • Both problems look at lower opportunity cost

Dollar Appreciation and Depreciation

Appreciation
  • Each dollar gets you more of the other currency
  • More of the foreign currency is needed to buy each dollar
  • US exports get more expensive for foreigners
    • US imports get cheaper for us
  • Exports decrease, imports increase, GDP decrease
  • Demand for the U.S. dollar will increase
  • Supply for the U.S. dollar decrease
Depreciation
  • Each dollar gets you less of the other currency
  • Exports increase, imports decrease, GDP increase
  • US exports get cheaper for foreigners to buy
  • US imports get more expensive for US
  • Demand of US dollar decrease
  • Supply of US dollar increase
  • Sources of Supply and Demand
  • Supply of US dollar comes from:
    • US citizens
    • Banks
    • Industries wanting to make foreign purchases
    • Investments
    • Assets
    • By making transfer payments to foreigners
  • Demand of the U.S. dollar comes from:
    • Foreigners
    • Banks
    • Industries wanting to purchase our goods
    • Investments
    • Assets
    • Make transfer payments to us

Foreign Exchange

Foreign Exchange (FOREX) - The buying/selling of currency
  • Ex. In order to purchase souvenirs in France, it is first necessary for Americans to sell (supply) their dollars and buy (demand) Euros
  • The exchange rate (e) is determined in the foreign currency markets
    • Ex. The current exchange rate is approximately 77 Japanese Yen to 1 US dollar
  • Exchange rate is price of a currency
4 Important Tips
  • Always change the D line on one currency graph, the S line on the other currency's graph
  • Move the lines of the two currency graphs in the same direction (right or left) and you have correct answer)
  • If D on one graph increases, S on the other will also increase
  • If D moves left, S moves left on other graph
Changes in Exchange Rates
  • Exchange rates (e) are a function of the supply and demand for currency
    • An increase in supply of currency makes it cheaper to buy one unit of it, vice versa for a decrease in supply
    • An increase in demand of currency will make buying one unit more expensive, vice versa for decrease in demand
  • Appreciation - Occurs when the exchange rate of that currency increases (e increases)
  • Depreciation - Occurs when exchange rate of that currency decreases (e decreases)
Determinants of Exchange Rate
  • Consumer Tastes
    • Ex. A preference for Japanese goods creates an increase in demand of Yen and an increase in the supply of the dollar
  • Relative Economy
    • Imports tend to be normal goods
    • Ex. if Mexico's economy is becoming stronger and the U.S. Economy is in recession, Mexicans will buy more of everything including American goods
    • Increases demand for dollar, causing dollar to appreciate and the peso to depreciate
  • Relative Price Level
    • If PL is higher in Canada than in US, American g
  • Speculation
    • Other currency will appreciate as demand for it increases
    • Supply of dollar will increase causing it to depreciate

Supply Side Economics & Laffer Curve

Supply Side Economics The belief that the AS curve will determine levels of inflation, unemployment, and economic growth.
  • To increase the economy, shift AS curve to the right
  • Supply side economists focus on marginal tax rate (the amount paid on the last dollar earned or on each additional dollar earned)
Supply Side Economists:
  • Believe that lower taxes are an incentive for a business to invest in the economy
  • Believe that lower taxes are incentive for workers to work hard, thereby becoming more productive
  • Also believe lower taxes are incentives for ppl to increase savings and therefore create lower interest rates which causes an increase in business investment
  • They support policies that promote GDP growth by arguing that high marginal tax rates along with the current system of transfer payments such as unemployment compensation or welfare programs provide disincentives to work, invest, innovate, and undertake entrepreneurial ventures
  • Coined as 'Reaganomics' - lower marginal tax rate to get out of recession, which worked, but it resulted in a deficit
Laffer Curve
  • Trade-off between tax rates and government revenue
  • Used to support supply side arguments
  • As tax rates increase from zero, tax revenues increase from 0 to some max level, then decline
Three Criticisms of Laffer Curve
  • Research suggests that the impact of tax rates on incentives to work, save and invest are small
  • Tax cuts also increase demand which can fuel inflation, thus creating a situation where demand exceeds supply
  • Where the economy is actually located on the curve is difficult to determine

The Balance of Payments

The Balance of Payments - Measure of money inflows and outflows between the U.S. and the rest of the world (ROW)
  • Inflow = Credit
  • Outflow = Debit
  • Balance of payments is divided into 3 accounts
    • Current account
    • Capital/financial account
    • Official reserves account
Double Entry Bookkeeping
  • Every transaction in the balance of payments is recorded twice in accordance with standard accounting practice
  • Ex. U.S. manufacturer, John Deere, exports $50 mil worth of farm equipment to Ireland
  • Credit of $50 mil to current account
  • (- (minus) $50 mil worth of equipment/assets)
  • Debit of $50 mil to capital financial account
  • (+ $50 mil worth of euros or financial assets
  • The two transactions offset each other. Theoretically, the balance payments should always equal zero
Current Account
  • Balance of Trade or Net Exports
    • Exports of goods/services - import of goods/services
    • Exports create a credit to BOP
    • Imports create a debit to BOP
  • Net Foreign Income
    • Income earned by US owned foreign assets
    • Ex. Interest payments on US owned Brazilian bonds - interest payments on German owned US Treasury bonds
  • Net Transfer (unilateral)
    • Foreign aid ---> Debit to current account
    • Ex. Mexican migrant workers send money to family in Mexico
Capital/Financial Account
  • The balance of capital ownership
  • Includes purchase of both real and financial assets
Relationship between Current and Capital Account
  • The current account and capital account should zero each other out
  • Current Account has negative balance (deficit), Capital Account should have positive balance (surplus)
Official Reserves
  • The foreign currency holdings of the U.S. Fed
  • When there is a balance of payments surplus the Fed accumulates foreign currency and debits the BOP
  • When there is a balance of payments deficit the Fed depletes its reserves of foreign currency and credits the BOP
  • Official Reserves zero out the BOP
Active v. Passive Official Reserves
  • The U.S. is passive in its use of official reserves. It does not seem to manipulate the dollar exchange rate
  • China is active in its use of official reserves. It actively buys and sells dollars in order to maintain a steady exchange rate with the U.S.


Phillips Curve

Philips Curve - Shows the relationship between unemployment and inflation
Long Run Philips Curve - Occurs at natural rate of unemployment
  • Represented by vertical line
  • There is no trade-off between unemployment and inflation in the long run (economy produces at full employment level
  • LRPC will only shift if LRAS curve shifts
  • LRAS shifts when technology and economic growth (same thing as outward PPC curve)
  • Cyclical does not happen during full employment 
  • The major LRPC assumption is that more worker benefits create higher natural rates and fewer worker benefits create lower natural rates
  • There is trade off between inflation and unemployment that only occurs in the short run
  • Inflation and unemployment are inverse
  • SRPC has relevance to Okun's Law
  • Since wages are sticky, inflation changes move the points on the SRPC
  • If inflation persists and the expected rate of inflation rises, then the entire SRPC moves upward which causes a situation called stagflation
  • If inflation expectations drop due to new tech or economic growth, then SRPC moves downward
  • Shift in PC is caused by determinants of AS
  • If it is AD it moves ALONG the curve
  • AS shocks cause both rate of inflation and rate of unemployment to increase
  • Supply shocks are a rapid and significant increase in resource cos
  • Misery index is a combo of inflation and unemployment in any given year. Single digit misery is good.
The Long-Run Phillips Curve (LRPC)
Because the LRPC exists at the natural rate of unemployment (Un), structural changes in the economy that affect Un will also cause LPRC to shift
  • Increase in Un shifts LPRC right
  • Vice versa


    Saturday, March 28, 2015

    Unit 4 Video Summaries

    Part 1:
    There are three different types of money in the money market, commodity, representative, and fiat. Commodity money is goods that has other purposes but still functions as money. Representative money is whatever you are using as currency represents a specific quantity of a precious metal, typically gold and silver. Fiat money is money that is not backed by a precious metal, it is a legal tender, it is money that must be accepted for transaction, and it is backed by the word of the government that it has value.

    Part 3:
    Demand for money slopes downwards because when the price is high, the quantity demanded is low. The supply of money is vertical because it does not vary based on the interest rate. The supply of money is set by the Fed. If the Fed wanted to bring the interest rate down than they increase the money supply. If they shift the money supply to the right they stabilize the interest rate.

    Part 4:
    The Fed has control over reserved requirements, which is the percentage of total deposits the banks must hang on to either as vault cash or be on reserve on a fed branch. If the fed wants to expand the money supply they will lower required reserves and that money will become excess reserves. If they want to contract the money supply they will raise the require reserves so you have less to deploy with. The discount rate is the rate of money in which the bank can borrow from the Fed. The fed buys bonds if they wants to expand the money supply, and if they want to contraction the money available they sell bonds.

    Part 7:
    Loanable funds is money available in the banking system for people to borrow. Demand is downward sloping because when the interest rate is lower the people demand more money. Supply of loanable funds comes from the amount of money that people have in banks, dependent on savings. If the government is running a deficit it means that the governmnt is demanding money in order to spend it. This will be shown with a shift of demand to the right which increases interest rate.

    Part 8:
    In the money creation process, banks create money by making loans. To find the money multiplier you use one over the reserve ratio. With a loan of $500 it does not necessarily mean that you get a total of $2500. It is only an assumption based on the bank not hold any excess reserves. The potential total increase is the initial loan times the multiplier. If any of the banks hold excess reserve in this process it will decrease the total it will reduce the total.

    Part 9:
    In the money market it shows an increase in demand because the government is borrowing money. As a result it demands more loanable funds which shifts the demand graph to the right. An increase in government spending will also increase aggregate demand, price level, and GDP. The change in the supply of money causes a change in price. This change is called the Fisher effect.

    Friday, March 27, 2015

    Unit 4

    Money
    Any asset that can be easily used to purchase goods and services


    Three uses of money

    •  medium of exchange
    • used to determine value
    • unit of account  
    •  store a value


    Three types of money

    • Commodity money 
      • value within itself (ex: salt, olive oil, gold)
    • Representative money 
      • represents something of value (ex:IOU)
    • Fiat Money 
      •  money because the government says so (ex: paper money and coins)

    *All money is not currency*

    6 characteristics of money

    1. Durability - how long it last
    2. Portability - take it anywhere
    3. Divisibility - can be broken down (coins or $)
    4. Uniformity - money that is the same no matter where you go
    5. Limited supply
    6. Acceptability 

    Money Supply: Total value of financial assets available in the U.S economy.


    M1 Money:

    • consist of liquid asset 
      •  easily convertible to cash (ex: currency, coins, checkable deposits(checks), travelers check)

    M2 Money:
    M1 Money + Savings Account + Money Market Account

    3 Purposes of Financial Institutions
    1.  store money
    2.  save money
    3.  loan money 
      • credit card 
      •  mortgages

    4 ways to save money
    1. Savings account
    2. Checking account
    3. Money market account
    4. Certificate of deposit (CD)

    Loans:
    • Banks operate on a fractional reserve banking system which means they keep a fraction of the funds and loan out the rest.

    Interest Rate:
    • principal 
      • amount of money borrowed
    • interest
      •  price paid from the use of borrowed money
        1. Simple interest- paid on the principal
        2. Compound- Paid in the principle plus accumulated interest


    I = PRT/100
    T= Ix100/PR
    P = Ix100/RT
    R = Ix100/PT

    I = Simple Interest
    P = Principal
    R = Interest Rate
    T = Time


    Types of financial institution
    1. commercial banks
    2. savings and loans institutions
    3. mutual savings bank
    4. credit union
    5. finance companies

    Investment: redirecting resources you would consume now for the future 

    Financial Assets: claims on property and income of borrower 

    Financial Intermediaries: institutions that channel funds from savers to borrowers 
    1.     Share risk through diversification - spreading out investments to reduce risk
    2.     Provide information
    3.     Liquidity (returns) - the money an investor receives above and beyond the sum of money that was initially invested

    **Bonds you loan**Stocks you own

    Bonds: loans or IOUs that represent debt that the government or a corporation must repay to an investor. Generally low risk investments. 

    3 Components of a Bond
    1.  Coupon Rate: the interest rate that a bond issuer will pay to a bond holder
    2.  Maturity: the time at which payment to a bond holder is due
    3.  Par Value: the amount that an investor pays to purchase a bond (Principal)

    Yield: the annual rate of return on a bond if the bond were held to maturity 

    Time Value of Money
    • Is a dollar today worth more than a dollar tomorrow? Yes. 
    • Why? Opportunity cost & inflation. This is the reason for charging and paying interest. 
    Let v = future value of $
    p = present value of $
    r = real interest rate (nominal rate - inflation rate), expressed as a decimal
    n = years
    k = number of times interest is credited per year 
    The simple Interest Formula:
    v = (1+r)^n x p
    The Compound Interest Formula
    v = (1 + r/k)^(nk) x p

    The Monetary Equation of Exchange
    MV = PQ
    M = money supply (M1 or M2)
    V = money's velocity (M1 or M2)
    P = price level (PL on the AS/AD diagram)
    Q = real GDP (sometimes labeled y on the AS/AD diagram)

    7 Functions of the Fed
    1. It issues paper currency
    2. Sets reserve requirements and holds reserves of banks
    3. It lends money to banks and charges them interest
    4. They are a check clearing service for banks
    5. It acts as personal bank for the government
    6. Supervises member banks
    7. Controls the money supply in the economy 

    The Three Types of Multiple Deposit Expansion Question
    Type 1: 
    Calculate the initial change in excess reserves. aka, the amount a single bank can loan from the initial deposit. 
    Type 2: 
    Calculate the change in loans in the banking system
    Type 3: Calculate the change in the money supply.Sometimes type 2 and type 3 will have the same result (I.e. No Fed involvement)
    Type 4: Calculate the change in demand deposits. 

    The amount of new deposits of new depots - required reserve = the i risk change in excess reserves. 


    Reserve Ratio = (Commercial Bank's Required Reserves) / (Commercial Bank's Checkable-Deposit Liabilities)

    Excess Reserves = Actual (Total) Reserves - Required Reserves

    Required Reserves = Checkable Deposits x Reserve Ratio

    Sunday, March 1, 2015

    Unit 3

    Aggregate Demand (AD): shows the amount of Real GDP that the private, public and foreign sector collectively desire to purchase at each possible price level.
    - The relationship between the price level and the level of Real GDP inversely related 
    - Curve goes downward

    Three Reasons why AD is Downward Sloping
    1) Real-Balances Effect: when the price level is high households and businesses cannot afford to purchase as much output
    - when the price level is low, households and businesses can afford to purchase more output 
    2) Interest-Rate Effect: a higher price level increases the interest rate which tends to discourage investment. 
    - A lower price level decreases the interest which tends to encourage investment. 
    3) Foreign Purchases Effect: A higher price level increases the demand for relatively cheaper imports
    - A lower price level increases the foreign demand for relatively cheaper US exports

    Shifts in Aggregate Demand (AD)
    - there are two parts to a shift in AD:
       - A change in C, Ig, G, and/or Xn
       - A multiplier effect that produces a greater change than the original change in the 4 components

    Determinants of AD:
    1) Consumption: household spending is affected by:
    - consumer wealth (more wealth = more spending, AD Shifts right) (less wealth = Less. Spending, AD shifts left)
    - Consumer Expectations (positive expectations = more spending,AD shifts right, negative expectations = less spending, AD shifts left)
    - Household Indebtedness
       - less debt = more spending, AD shifts right
        - more debt = less spending, AD shifts left
    - Taxes
       - less taxes = more spending, AD shifts right
       - more taxes = less spending, AD shifts left

    2) Gross Private Investment:
    - Investment Spending is sensitive to:
       - The Real Interest Rate
           - Lower Real Interest Rate = More Investment, AD shifts right
           - Higher Real Interest Rate = Less
     Investment, AD shifts left
        - Expected Returbs
           - higher expected returns = more investment, AD shifts right
           - lower expected returns = less investment, AD shifts left
           - Expectrd Returns are influenced by expectations of future profitability, technology, degree of excess capacity (existing stock of capital), business taxes)

    3) Government Spending
    - more government spending shifts AD right
    - less government spending shifts AD left

    4) Net Exports
    - Net exports are sensitive to
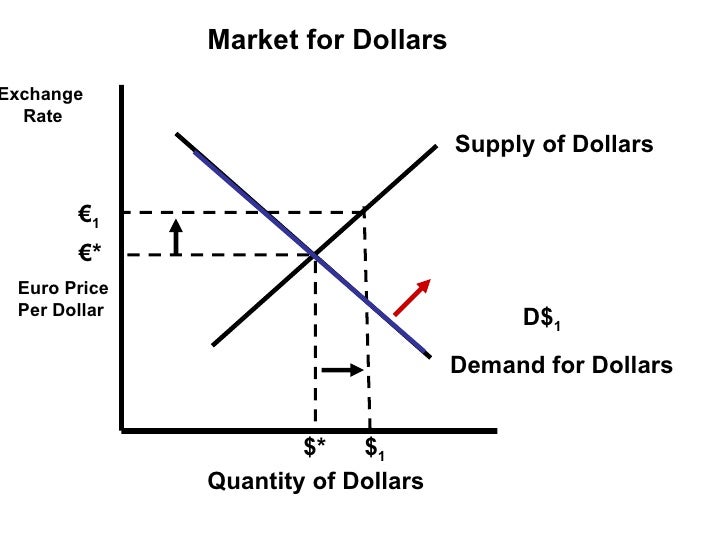
    - Exchange Rates (International Value of $)
       - Strong $ = more imports and fewer exports, AD shifts left
       - Weak $ = fewer imports and more exports, AD shifts right
    - Relative Income
       - String Foreign Economics = More Exports, AD shifts right
       - Weak foreign economies = less exports, AD shifts left 

    Aggregate Supply: The level of Real GDP
    Long-Run: Peruod of time where input prices are completely flexible and adjust to changes in price level
    - In the long run, the level of real GDP supplied is independent of the price level
    Short Run: Period of time where input prices are sticky and do not adjust to changes in the price level
    - the level of Real GDP a supplied is directly related to the price level 

    LRAS: marks the level of full employment in the economy (analogous to PPC) 
    - because input prices are completely flexible in the long-run, changes in price-level do not change firms' real profits and therefore do not change firms' level of output. This means that the LRAS is vertical at the economy's level of full employment

    SRAS: Because input prices are sticky in the short-run, the SRAS is upward sloping. this rejects the fact that in the short run, increases in the price level increase firm's profits and create incentives to increase output.

    Changes in SRAS:
    - an increase in SRAS a is seen as a shift to the right. Decrease is shift to the left
    - The key to understanding shifts in SRAS is per unit cost of production
    * (Per-unit production cost) = (total input cost) / (total output)

    Determinants of SRAS (all of the following affect unit production cost):
    1) input prices
    2) productivity
    3) legal institutional environment

    Input Prices
    - Domestic Resource Prices
       - Wages (75% of all business costs)
       - Cost of capital
       - Raw Materials (commodity prices)
    - Foreign Resource Prices
       - Strong $ = lower foreign resource prices
       - Weak $ = higher foreign resource prices
    - Market Power
       - Monopolies and cartels that control resources control the price of those resources 
    - Increases in resource Prices = SRAS shifts left
    - Decreases in Resource Prices = SRAS shifts right 

    Productivity
    - (Productivity) = (total output) / (total inputs)
    - More productivity = lower unit production cost = SRAS shifts right
    - Lower productivity = higher unit production cost = SRAS shifts left

    Legal-Institutional Environment  
    - Taxes and Subsidies:
       - Taxes ($ to govt) on business increase per unit production cost = SRAS shifts shifts left
       - Subsidies ($ from govt) to business reduce per unit production cost = SRAS shifts right
    - Government Regulation
       - Government regulation creates a cost of compliance = SRAS shifts left
       - Deregulation reduces compliance costs = SRAS shifts right


    • Full Employment equilibrium exists where AD intersects SRAS & LRAS at the same point. 
    • recessionary gap exists when equilibrium occurs below full employment output. 
    • Anytime you're in a recession or recessionary gap, AD is shifting to the left (decreasing)
    • An inflationary gap exists when equilibrium occurs beyond full employment output. AD shifts to the right (increase)
     
    Investment: money spent or expenditures on: new plants (factories), capital equipment (machinery), technology (hardware & software), new homes, inventories (goods sold by producers)
     
    Expected Rates of Return:
    1) How does business make investment decisions? Cost/Benefit Analysis
    2) How does business determine the benefits? Expected rate of return
    3) How does business count the cost? Interest costs
    4) How does business determine the amount of investment they undertake? Compare expected rate of return to interest cost. If expected return > interest cost, then invest. If expected return < interest cost, do not invest. 
     
    Real (r%) vs Nominal (i%)
    - Nominal is the observable rate of interest. Real subtracts out inflation (pi%) and is only known ex post facto. 
    r% = i% - pi%
    - What then, determines the cost of an investment decision? The real interest rate (r%)
     
    Investment Demand Curve (ID)
    - What is the shape of the investment demand curve? Downward sloping
    - Why? When interest rates are high, fewer investments are profitable; when interest rates are low, more investments are profitable. 
     
    Shifts in Investment Demand (ID):
    1) Cost of Production
    - Lower costs shift ID right
    - Higher costs shift ID left
    2) Business Taxes
    - Lower business taxes shift ID right
    - Higher business taxes shift ID left
    3) Technological Change
    - New technology shifts ID right
    - Lack of technological change shifts ID left
    4) Stock of Capital
    - If an economy is low on capital, then ID shifts right
    - If an economy has much capital, then ID shifts left 
    5) Expectations
    - Positive expectations shift ID right
    - Negative expectations shift ID left

    Long-Run Aggregate Supply
    - LRAS curve represents a point on an economy's production possibility curve. 
    - The LRAS is a vertical line at an output level that represents the quantity of goods and services a nation can produce over a sustained period using all of its productive resources as efficiently as possible. 
    - LRAS is always at full employment. It does not change as the price level changes. 
    - LRAS shifts outward if there is a change in technology, a change in resource, or if there is economic growth.
     
    Disposable Income: income after taxes or net income. 
    DI = Gross Income - Taxes
    - With disposable income, households can either:
    1) Consume (spend money on goods & services)
    2) Save (not spend money on goods & services)

    Consumption:
    - Household spending
    - The ability to consume is constrained by:
       - The amount of disposable income
       - The propensity to save
    - Do households consume if DI = 0?
       - Autonomous consumption
       - Dissaving
    - APC = C/DI = % DI that is spent

    Saving:
    - Household NOT spending
    - The ability to save is constrained by:
       - The amount of disposable income
       - The propensity to consume
    - Do households save if DI = 0?
       - NO
    - APS = S/DI = % DI that is not spent

    APC & APS
    - APC + APS = 1
    - 1 - APC = APS
    - 1 - APS = APC
    - APC > 1 .: Dissaving
    - -APS .: Dissaving

    MPC & MPS
    - Marginal Propensity to Consume
       - Change in C / Change in DI
       - % of every extra dollar earned that is spent
    - Marginal Propensity to Save
       - Change in S / Change in DI
       - % of every extra dollar earned that is saved
    - MPC + MPS = 1
    - 1 - MPC = MPS
    - 1 - MPS = MPC

    The Spending Multiplier Effect
    - An initial change in spending (C, Ig, G, Xn) causes a larger change in aggregate spending, or Aggregate Demand (AD). 
    - Multiplier = Change in AD / Change in Spending
    - Multiplier = Change in AD / Change in C, Ig, G, or X
    - Why does this happen? Expenditures and income flow continuously which sets off a spending increase in the economy. 
    - The Spending Multiplier can be calculated from the MPC or the MPS
    - Multiplier = 1 / (1-MPC) or 1/MPS
    - Multipliers are (+) when there is an increase in spending and (-) when there is a decrease. 

    Calculating the Tax Multiplier
    - When the government taxes, the multiplier works in reverse
    - Why? Because now money is leaving the circular flow. 
    - Tax Multiplier (note: it's negative)
       = -MPC/(1-MPC) or -MPC/MPS
    - If there is a tax-CUT, then the multiplier is + because there is now more money in the circular flow
     
    Fiscal Policy: Changes in the expenditures or tax revenues of the federal government
    2 Tools of fiscal policy:
    - Taxes: Government can increase or decrease taxes
    - Spending: Government can increase or decrease spending 
     
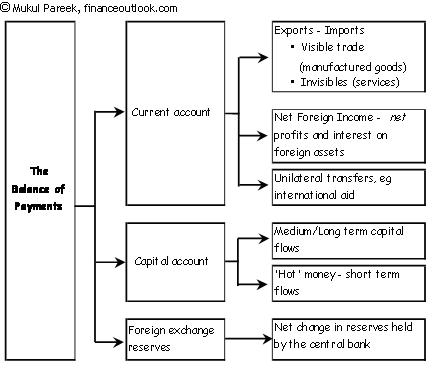
    Deficits, Surpluses, & Debt
    - Balanced Budget: Revenues = Expenditures
    - Budget Deficit: Revenues < Expenditures
    - Budget Surplus: Revenues > Expenditures
    - Government Debt: (Sum of all deficits) - (Sum of all surpluses)
    - Government must borrow money when it runs a budget deficits
    - Government borrows from: individuals, corporations, financial institutions, foreign entities or foreign governments 
     
    Fiscal Policy Two Options
    - Discretionary Fiscal Policy (action)
       - Expansionary fiscal policy - think deficits (recession)
        - Contractionary fiscal policy - think surplus (inflationary period)
    - Non-Discretionary Fiscal Policy (no action)
     
    Discretionary v. Automatic Fiscal Policies
    •  Discretionary: Increasing or decreasing government spending and/or taxes in order to return the economy to full employment. Discretionary policy involves policy makers doing fiscal policy in response to an economic problem. 
    • Automatic: Unemployment compensation and marginal tax rates are examples of automatic policies that help mitigate the effects of recession and inflation. Automatic fiscal policy takes place without policy makers having to respond to current economic problems.
     
    Contractionary vs. Expansionary Fiscal Policy
     
    •  Contractionary fiscal policy - policy designed to decrease aggregate demand
       - strategy for controlling inflation
    •  Expansionary fiscal policy - policy designed to increase aggregate demand
       - strategy for increasing GDP combating a recession & reducing unemployment 
     
    Expansionary Fiscal Policy
    - Increases government spending
    - Decrease taxes 
     
    Contractionary Fiscal Policy
    - Decrease government spending
    - Increase taxes
     
    Automatic or Built-In Stabilizers
    - Anything that increases the government's budget deficits during a recession and increases its budget surplus during inflation without requiring explicit action by policy makers. 

     
    Nondiscretionary Fiscal Policy (Automatic Stabilizers)
    1) Transfer Payments
         - Welfare checks
         - Food Stamps
         - Unemployment checks
         - Corporate dividends
         - Social Security
         - Veteran's benefits
     
    Progressive Tax System: Average tax rate (tax revenue/GDP) rises with GDP
    Proportional Tax System: Average tax rate remains constant as GDP changes
    Regressive Tax System: Average tax rate falls with GDP
     
     
    The Three Schools of Economics
     

    Classical:

    • Adam Smith, John B Say, David Ricardo, and Alfred Marshall 
    • competition is good
    • invisible hand: the market basically runs itself
    • laissere faire: no government intervention
    • say's law: supply creates its own demand
    • economy is always close to or at full employment
    • in the long run, economy will balance out at full employment 
    • trickle down effect: help rich first, then help everyone else
    • savings increase with the interest rate
    • prices and wages are flexible and downward.
    • AS determines output.
    • AS=AD at full equilibrium.
     

    Keynesian:

    • John Maynard Keynes, Congress
    • competition is flawed
    • AD is the key, not AS
    • Demand creates its own supply, AD creates its own output 
    • Savers does not equal investment
    • Savings are inverse to interest rates
    • Leaks causes constant recessions
    • Savings also causes recession
    • Ratchet effects and sticky wages block Say's law
    • Since there is no mechanism that is capable of garunteeing full employment, in the long run we are dead
    • The economy is not always close to or at full employment
    • Uses Fiscal Policy, Will add stabilizers , Will use expansionary and contractionary policies. 

    Monetary:

    • Allen Greenspan, Ben Bernanke
    • Congress can't time the policy option
    • Voters won't allow contractionary options
    • Easy money/Tight money
    • We can change the required reserves of needed.
    • We can buy and sell bonds through open market operation
    • We can use the interest rate to change the discount rate and the federal fund rate